North Middletown, Kentucky • Est. 1948 • Home of the Kings

Save North Middletown Elementary School.

Closing NMES does not save money. We priced it 972 ways. The likely net result: a LOSS of $340,000 to $520,000 a year. Every priced scenario loses money.

On July 15, 2026, a planning committee voted to label NMES "transitional": step one toward closing it. So we dug into public records and filed Open Records Requests to inform the Board. Check every number below. Every assumption is stated openly so it can be challenged; swap in your own with the calculators.

Key Points

The case against closing NMES is clear. It has the county's best test scores. It costs less than the average Kentucky elementary school. We priced closure 972 ways on the district's own figures, with family departures measured by the signed survey below, not guessed. Every weighted outcome loses money.

The district needs growth, not closures. Enrollment is down 10 percent while the county's child count is flat. Costs are up at every school. The tax rate is lower than almost every neighbor's.

We ask the board for four things:

  1. Keep NMES Permanent in the facility plan.
  2. Give the school the four years until the next plan to grow, with public targets.
  3. Let the school and community raise grant and private money for the building.
  4. Say publicly that the district will help this school grow.

Written by volunteers from the NMES community, past and present, including Dr. Ryan Bradley, a former NMES King and Bourbon County Colonel. The work was accelerated with the use of an AI research assistant. Built from public records and Open Records Requests only. Full report and model at the bottom of this page.

Part One

The Case Against Closing NMES

Four facts: the school works, it is not expensive, closing it frees very little now, and closing it risks a lot.

Fact One

The school works.

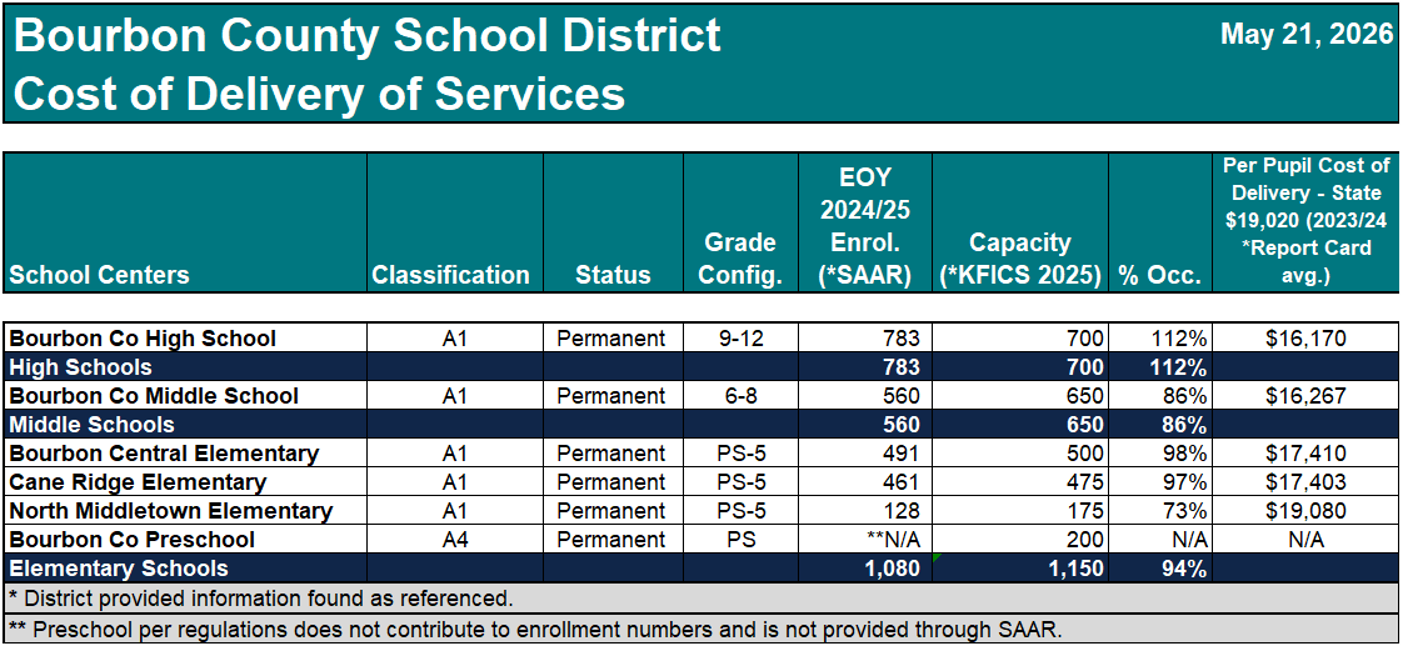
On the state's 2024-25 tests, NMES is first in the county in every subject. It beats the state average in science and writing. It is a 2011 National Blue Ribbon School, one of five Kentucky public schools that year.

More detail: the scores

The state's own numbers, 2024-25

Percent proficient or betterNMESBourbon CentralCane RidgeKY average
Reading41383749
Mathematics31282743
Science5326*37
Social Studies36312738
Writing56402743

Kentucky Summative Assessments, all students. Asterisks are state-suppressed results: Kentucky withholds a row when any level holds fewer than three students (KDE's written rule, archived in the repository). NMES also led the county in math every pre-COVID year and earned a Distinguished rating in 2016.

Two decades of scores

The chart defaults to the five real test subjects. The official composite is off by default. It is not a pure test score: it folds in a climate survey and a change-from-last-year piece. That is why Bourbon Central's composite crosses NMES in the newest year despite NMES leading every 2024-25 subject the state computed. The component file, archived in the repository, shows it.

Every grade, every subject, every level

The table above combines all tested grades; this is the record underneath: each school's share at the state's four levels, grade by grade. Red and amber sit below the proficiency line, green and blue at or above. The right-hand number is percent proficient or distinguished, per KDE; the star marks the district leader.

KDE School Report Card files, 2024-25, all students, archived in the repository. Paris Elementary is a separate district, not shown. State rounding: rows may not total 100. Why the two views differ: the combined table counts every grade, suppressed ones included. KDE's fewer-than-three rule (above) withholds all four levels; too few strugglers suppresses a grade as easily as too few stars. NMES's third grade is suppressed in reading and mathematics: in the combined figure, not the bars, so the combined number falls below either published grade. Third grade is the weakest year at every school here, NMES included. Read the small numbers with the small school in mind: NMES tested 26, 19 and 28 children in grades 3, 4 and 5; Bourbon Central 109, 82 and 74; Cane Ridge 97, 71 and 80. So one child moves an NMES subject score about four to five points, versus about one at the larger schools.

Fact Two

The school is not expensive.

On the newest state spending file (2024-25), NMES costs $17,903 per student. The average Kentucky elementary school costs $19,299. NMES runs 7 percent below the state average.

More detail: the cost record

What each elementary school has cost, every year the state published it

The chart starts in 2014: the 2013 file's one-time renovation charge would swamp the scale. The state changed its method after 2016-17, so compare within an era. Modern era: NMES sat below the Kentucky elementary average in five of the eight years, 7 percent below on the newest file.

More students means a lower cost per student

Most of what NMES costs is the building and its fixed staff. Add students and cost per student falls, even counting supplies, busing, and new hires as classes fill. It already beats the five-year Kentucky elementary average; from about 135 students, the county's other elementaries too:

Dashed lines are five-year averages from the same files: Kentucky elementary schools $18,051, the county's three elementaries $17,090. At the 198 seats the state approved in 2013 (the current plan rates it 174; the community's targets aim back at 198): about $12,500 per student, cheaper than every school in the county today. One per 21 is today's class size; the upward steps are new hires.

Fact Three

Closing it frees very little now.

Start from everything the district spent on this school last year: $1,285,310, from its own ledger. Most of it moves with the children or pays for itself. Only the building's own costs stop: $79,211 a year if staff are reassigned, up to $127,039 on the district's own worksheet if the building is sold. The $661,139 figure leans on $493,407 of staffing savings the district says arrive only if staff leave by attrition. In year one, the year a vote is about, its paperwork supports $127,039.

More detail: the ledger walk and the district's claim

Walk the ledger: what closing can and cannot save

Every number below is from the district's own MUNIS ledger, fiscal 2026. Start at the top. Remove everything that keeps getting spent anyway:

Everything spent on NMES last yearall funds, the district's own ledger
Federal and grant moneyfollows the child to the next school
Food servicepays for itself from meal money
Student activity moneythe students' own funds
General Fund: the money actually in play
Classroom teachingmoves: the same kids need the same teachers
Other instructional programsmoves with the students
Principal and officesaved only if the people are cut; the superintendent says all staff keep their jobs
The building itself: utilities, disposal, phone, supplies, repairsSTOPS when the building closes
Custodiansaved only if cut; the superintendent says retained
Librarysaved only if cut; the superintendent says retained
Student healthmostly follows the students
Transportation and otherdoes not stop
Special education coded at the schoolservices follow the child; the special-education staff sit at the district office
What actually stops when the building closesplus $20,000 of district-held insurance and the rest of their worksheet's building lines if it is sold: at most $127,039

Sources: the district's MUNIS ledger (Cost by ORG, fiscal 2026) and the superintendent's Response to the 10 Questions, which says all current staff stay. Both archived in the repository.

Where the superintendent's $661,139 comes from, and why it may never show up

The district's written response prices closure savings at "$661,138.94 MINIMUM." Take it apart the same way:

The claim"$661,138.94 MINIMUM," the superintendent's response
Staff, priced with benefitsthe same response says all staff keep their jobs, so this saves $0
Supplies, books, field tripsspent wherever the kids sit
What is left: building costs and insurancereal, and already counted in the walk above

The district's response prices no added busing and not one leaving family.

Sources: the Response to the 10 Questions and the July 2026 records response, both archived in the repository.

Fact Four

Closing it risks a lot, every year, for thirteen years running.

Every enrolled child brings the district $5,126 a year in state money. A leaver takes it along every year until they would have finished 12th grade. This is no longer a guess. The signed survey below measures who would go. The likely loss: $599,742 to $789,404 a year. Even the low edge beats any saving the priced closure grid can produce.

More detail: the market and the measured exodus

Schools compete now. K-5 is where you win or lose families.

Under HB 563, state money follows the child to whichever district wins the family.

A kindergartner carries about $67,000 to $76,000 of state money over 13 years: $5,126 a year at the enacted FY2027 base plus typical add-ons, $66,638 if funding never rises, $75,716 if the base keeps its recent 2.1 percent yearly growth. About one in eight current middle and high schoolers came through NMES: 128 students, 12.3 percent of the county's 1,040 elementary seats, a share that carries up the grades. The exits are everywhere: Paris Independent next door; Montgomery, Clark, and Scott counties close by, most charging nothing; Fayette pulling 54 commuters; homeschool and the state virtual academy open for business. Closing the only east-side school quits the market where competition is thickest.

What leaving families cost: measured, not guessed

Every exit is free to the family and funded for the district that wins the child. The August 2026 survey (results below) replaces hypothetical shares. A leaver is missing through grade 12: 12.62 effective years at the $4,626 base plus $500 of add-ons.

EstimateBasisStudents missing each yearSEEK lost each year
Today's students43 to 57 percent of the 115 enrolled now49 to 65$251,174 to $333,190
Steady statethe same share of the whole feeder stream, middle half117 to 154$599,742 to $789,404
Steady-state medianthe middle of the band136$697,136

The loss grows until year eight, when the oldest lost class reaches grade 12, then holds. Priced on the official 2024-25 roster of 128, the school's students carry about $6.2 to $6.9 million of remaining state funding through grade 12 (1,339 student-years, at the $4,626 base to $5,126 with add-ons). And per the district's own advisor's June 2026 presentation, every 50 students lost take about $1 million of bonding capacity with them.

Where school choice is open, this is how it goes. Council Bluffs, Iowa closed rural Crescent Elementary in 2023 with 127 school-age children in its zone and 49 attending; students scattered to homeschool, neighboring districts, and a replacement charter. Palmyra-Eagle, Wisconsin lost up to 40 percent to open enrollment; its board voted to dissolve the district (a state panel later kept it open). Orient-Macksburg, Iowa lost 53 percent and dissolved in 2025. River Valley, Wisconsin closed two rural elementaries in 2017 and 2018 to save money. Seven years on, still shrinking, it closed a third and went to referendum to survive. These are measured actions, not promises: our corrected band, 43 to 57 percent, sits between the 40 percent Palmyra-Eagle actually lost and the 53 percent Orient-Macksburg actually lost. The survey predicts what comparable communities already did. No Kentucky district has closed a rural elementary in the HB 563 era and published what happened next. Bourbon County would be the experiment. Every case is sourced below.

Run the Numbers

Two calculators, closure, and growth.

Built on district data. Change the assumptions yourself. Close it, and the middle case LOSES $427,087 a year. Grow it, and every scenario in which students arrive pays, middle case +$141,780.

The calculators and the full range

Closure: what does it actually net?

Six levers, opening at the grid's weighted median scenario, the middle result of all 972: three quarters of the building costs captured, no fixed positions cut, three teachers cut, the band's high 154 leavers with no add-ons, minimal busing. A middle result, not a middle setting; drag any lever to test your own read. Each missing student takes $4,626 plus add-ons and stops costing $400 in supplies. Teacher cuts sit on their own lever. Staffing uses the district's own $54,479 rate. Fixed-position lines are FY2026 actuals from its MUNIS ledger.

-$427,087
net effect per year at these settings

Grant closure every saving that scales with students, building sold, three teachers cut, half the fixed overhead cut over time, at the median 136 leavers, and it still loses $308,207 a year, the 82nd percentile. That is more generous than the district's own stance; the superintendent's written statement says all staff keep their jobs. The tax line uses the certified real estate roll's $166,189 per cent of rate (the fiscal 2025 audit's valuation and levy; the restricted building-fund levy not counted) and the median homeowner's $15.69 a month for 8.9 cents.

Growth: what does filling NMES net?

The building held 261 children at its peak; 115 today against a 174 rating. The pool is real: 236 in the district's own homeschool files, 450 to 550 Bourbon County Schools kids in homeschool, private school, or another district, 131 driving in already. Each new student brings $4,626, the enacted FY2027 SEEK base. The first 25 added students fill seats open at the district's class caps. Past them, a teacher per full new class.

$141,780
net new dollars per year at these settings

The calculator opens at 30 added students, $141,780 a year: the weighted median itself. No new hires, low busing and supplies (at the central $500 and $700, 30 students net $117,780, the 34th percentile). From the 2024-25 count of 128 instead of the district's 110, the 140 target adds 12 students, about $57,000 a year; from the 2025-26 count of 115, 25 students, $118,150. Added students count as recovered from outside the district; in-district transfers bring no new money. Five-student steps keep every setting inside the grid's floor and ceiling. Full method in the report.

More detail: every scenario, side by side

Every scenario, side by side

Nobody knows exactly how either road plays out. So we priced every reasonable version of both on the district's own numbers: 972 closure scenarios, 19,683 growth scenarios. Each bar runs worst to best: the shaded band is the middle half, the navy tick the middle result, and the gold marker is your scenario, live from the sliders. Weighting and method are in the report.

Close it

Every priced outcome loses money; the middle half runs from losing $518,405 to losing $338,727. The families-leaving lever, once the biggest unknown, is now anchored to the signed survey below. Your closure scenario: the 50th percentile.

Grow it

Not one scenario loses money (each prices students who actually arrive; if none come, growth nets zero); the middle half runs from gaining $94,520 to gaining $182,654. Cost and staffing inputs trace to district documents; the assumption levers are yours to reset. Your growth scenario: the 50th percentile.

More detail: the exodus ledger, what leaving actually costs

The exodus ledger

Each enrolled child brings $5,126 a year in state SEEK funding ($4,626 base plus $500 typical add-ons). A leaver is missing for every remaining grade through 12th. 95 to 100 percent of county fifth graders stay through 11th grade, and 83 percent of seniors finish: each lost child counts 12.62 effective years, not 13. The August 2026 survey measures leavers as a share of the school:

The band, tabled in Fact Four: 117 to 154 students missing at steady state, $599,742 to $789,404 a year; today, 49 to 65 of the 115 enrolled. The estimate corrects for response bias: leavers answer more readily than stayers, so the sample's 83 percent leave rate is discounted hard. The band is the middle half of the corrected share, applied to the 115 enrolled today and to the whole feeder stream of about 22 entering kindergartners a year. The state's SAAR files back the band from outside the survey: this year's kindergarten enrolled 12 children against a ten-year average of 22. Losses build from six grade cohorts in year one to all thirteen by year eight. The closure grid prices the steady state.

Leaving is not pure loss, and the model counts nothing twice. Each missing student stops costing about $400 in supplies and materials, the same figure the growth model charges per new student. Cutting teachers is separate, priced only on the teachers-cut lever (the district's own 0 to 3 positions). Even at their friendliest, closure still loses money in every priced scenario: $400 and a few positions cannot outrun $5,126 walking out per child.

The bottom line: your two scenarios, live from the calculators above
Grow it
+$141,780
a year at your growth settings; the default sits at the weighted median. Not one scenario loses
Close it
−$427,087
a year at your closure settings; the calculator opens at the weighted median of all 972 scenarios
Part Two

The District Needs Growth, Not Closures

The district has a real money problem. It is district-wide. NMES did not cause it, and closing NMES does not dent it. Three problems, three levers, one priced plan.

The Three Problems

Money, enrollment, revenue.

The gap is real: $2.65 million last year. The causes are district-wide: an enrollment leak worth about $2.2 million a year and the region's only falling levy. Closing one small school touches none of them.

More detail: the three problems, charted

1. The money problem

The General Fund ran a $2.65 million deficit in fiscal 2025. The district's June 2026 ledger trends fiscal 2026 about $1.74 million red: better, still red. Reserves fall about $1.1 million a year. The causes are plain: pandemic aid ended, and funded attendance dropped by roughly 247. SEEK pays on attendance, not on enrollment headcount: about 91 percent of enrollment here, and our per-child price skips the formula's extra weights. The ledger shows about $374,000 down, but only after a lawful $1.32 million sweep of restricted building money into operations via a state Capital Funds Request. That sweep spends the stream that should pay for buildings. The slide is not over. The 2026-27 SEEK forecast puts funded attendance at 2,174, down again.

A same-year yardstick: Bourbon and Fayette on their audits

Both districts' fiscal 2025 audits carry clean opinions. Held to the same year and the same two measures: yearly gap before transfers, 9.1 cents per General Fund dollar spent at Bourbon (its third deficit in three years) versus 5.7 cents at Fayette. June 30, 2025 cushion: 14.7 cents of reserve per dollar of spending at Bourbon versus 4.1 cents. Bourbon has the larger cushion and the larger gap:

Basis, both FY2025 audits, archived in the repository: gaps of $2,648,086 against $29,097,404 (Bourbon) and $38,907,376 against $685,348,803 (Fayette); reserves of $4,290,840 and $28,361,786, after Fayette's balance fell $14.9 million, from $43.3 million to $28.4 million, in a year its budget book planned flat.

Fayette's figures moved after that audit. On August 3, 2026 its board received an independent budget-process audit by Weaver, L.L.P., archived here with Fayette's release. After Fayette's unaudited June 2026 corrections to its fiscal 2025 ledger, Weaver puts year-end General Fund balance at $6,902,403, about 1 percent of $690,460,223 spent. That is below the 2 percent minimum KRS 160.470(6)(a) sets statewide, and below Fayette's own 6 percent policy. That sits $21.5 million below the $28,361,786 its audited statements report for the same June 30, 2025 date. Weaver's deck does not reconcile the two. It calls its figures unaudited, subject to change "as the District continues to address identified misstatements." The unsupported entries: a $3.5 million tax receivable with no documentation, about $8 million of receivables miscoded as revenue since 2019, an unexplained $20.4 million salary overage.

How long each cushion lasts depends on which burn rate is used. Bourbon's fund balance fell $1,225,465 last year, 4.2 cents per dollar spent, after $1,422,621 of net other financing came in, $1,320,939 of it the sweep of restricted building money. On operations alone the gap was 9.1 cents. The plan here ends the sweep, so it uses the operating gap: a 14.7-cent cushion covers about a year and a half at 9.1 cents, about three and a half years at 4.2. Fayette, same basis: 5.7 cents against a 4.1-cent cushion, under a year, nearer one cent on Weaver's unaudited view, with up to $95 million of borrowing approved to reach fall tax collections. Weaver's 70-plus recommendations and 10 priority actions cover budget controls, forecasting, reconciliation, reporting, and rebuilding the reserve. None of them is a school closure.

2. The enrollment problem is leakage, not demographics

The county's children never left. Census counts: 3,594 kids in 2000, 3,548 in 2020. But Bourbon County Schools' enrollment fell 10.2 percent since 2014. Where this district's missing students sit, measured:

Homeschool: 236 students in Bourbon County Schools' own files (letters of intent under KRS 159.160), up from 156 in 2018-19; county-wide with Paris Independent, 259 registered homeschoolers, up from 170 five years ago. That count is a floor. At $4,226 of state money each, about $1.0 million a year.
Private school: two in the county. St. Mary in Paris enrolls 96 on the federal survey; its split between the two zones is unpublished. Bourbon Christian Academy in Millersburg (K-12, homeschool-grown) skips that voluntary survey, so its students go uncounted. New private options keep opening a short drive away.
Other districts: 247 residents enrolled elsewhere. KDE's file counts 247 Bourbon County Schools residents in another district: 171 at Paris Independent, 76 out of county. Each takes their state money along.

Add it up: about 450 to 550 kids from Bourbon County Schools are homeschooled, in private school, or enrolled in another district. The documented counts alone, 236 homeschool and 247 in other districts, reach 483: the band is conservative. County-wide, 13 to 15 percent of school-age kids sit outside public school entirely. At the full $4,626 SEEK check each, that is $2.1 to $2.5 million a year the district is not collecting. The plan below credits recovered students at $4,226, net of supplies. This is a competition problem. Competition problems have competition answers.

3. The revenue problem

Bourbon taxes real estate at 52.4 cents per $100, second lowest of nine area districts. Every neighbor's rate is higher than fourteen years ago. Bourbon's is 5.4 percent lower, the only drop in the region, while its tax base grew 107.5 percent, second fastest of eight area counties. Every neighboring board facing the same rising assessments chose to keep more revenue. The choice is still on this board's table: a decision, not an admission.

The Three Levers

Grow enrollment. Cut fixed costs. Fix the rate.

Three levers the board already owns: enrollment, fixed costs, and the tax rate. Every version of the plan clears the trending $1.74 million fiscal 2026 gap. All but the very floor fund a 5 percent raise for every certified teacher:

Low: no students recovered, low costs, full 2018 restore: about $500,000 a year to spare and the advisor's $32 million of building capacity.

Middle, the default: half the leakage pool back (275 students), costs still low: about $1.7 million to spare and about $47 million of capacity.

High: the full pool and every lever: about $3.4 million to spare and about $69 million of capacity.

All three stand on the $32 million of bonding capacity the district's own financial advisor presented in June 2026. Every school stays open. The math is below.

More detail: the levers, priced

Lever 1: Grow enrollment. It works in Kentucky, at this scale, an hour away.

Eminence Independent, a small Henry County district, was shrinking too. It rebuilt around a distinctive program and open enrollment and grew 35 percent in a decade, 733 to 991 students. Four in ten now come from other districts, each bringing state money.

Federal fall counts, indexed to 2014 = 100 (Eminence 733 to 991; Bourbon 2,912 to 2,616). Near-term band for district-wide recovery: $260,000 to $530,000 a year net of costs. Correction: an earlier version said $1.1 to $3.3 million, unsupported by the model's own rows; corrected everywhere it flowed.

Lever 2: Cut fixed costs district-wide, where the real money is

Inspect every non-teaching position, district-wide. Trim through attrition, not layoffs, and never touch a classroom. Worth $340,000 to $425,000 a year at the district's own loaded costs.

Consider restructuring the administration. To be fair, the district's own audit table traces recent central-office growth mostly to insurance, one-time payouts, and contract changes, not new hires. A structural review is still worth $224,000 to $450,000 a year.

Smarter bus routes. Busing runs $2.9 million a year on the audited fiscal 2025 line, up 20.3 percent in one year. No routing study has ever been produced. A 5 to 10 percent trim is $146,000 to $291,000 a year.

Smarter energy use. Kentucky school energy contracts routinely cut utility bills 10 to 25 percent and pay for themselves. Worth $50,000 to $150,000 a year. The district's energy review is already underway: a head start.

All four together: $760,000 to $1.3 million a year. The attrition line counts positions and the administrative line counts non-salary spending (insurance, fees, payouts), so the two do not double count.

These four are parts of one total, not additions. Every line is priced in the model's Alternatives tab. Nothing here closes a school or cuts a teacher.

Lever 3: Restore the tax rate to its 2018 level

Bourbon levies 52.4 cents, second lowest of nine districts, and less than this same board levied in 2018. The county's tax base has more than doubled since 2012. Restoring the board's 2018 rate, 8.9 cents, brings about $1.5 million a year on the certified real estate roll: real money to compete with. Like every neighbor's increases, the portion above 4 percent revenue growth is subject to voter recall under KRS 160.470. This community has twice declined to recall its facilities nickels. And the 2018 rate is not a ceiling: the menu beyond it, priced in the report, reaches $0.9 to $2.2 million a year.

$1,479,078
recurring revenue per year, from year one

The plan, priced: set it yourself

The plan must close the current gap: fiscal 2026 trends about $1.74 million in the red (fiscal 2025's audited gap: $2.65 million). The floor already clears it: low costs plus the full rate restore leave about $500,000 a year to spare before a single student comes back, within $7,000 of the full 5 percent raise. Against the audited $2.65 million gap the floor runs about $409,000 short; the menu's unused lines (delinquency recovery, the deeper cost package) cover it. It balances the budget, ends the capital sweep, closes nothing.

What the surplus buys. The calculator opens at the middle case: 275 of 550 students recovered, worth $1,162,150 a year at $4,226 each. That runs about $1.66 million a year ahead of the gap. It funds the 5 percent raise for every certified teacher (about $507,000 a year) plus roughly $15.0 million of new bonds on top of the advisor's $32 million of bonding capacity, real once the $1.32 million-a-year capital sweep ends. Together: about $47 million of building capacity, a raise, every school open. Every 100 recovered students move it by $422,600 a year. Every step is live in the model's Alternatives tab.

$1,662,575
surplus per year after closing the trending $1.74 million fiscal 2026 gap

Proposed public targets, the kind ask two puts on paper: 145 by fall 2027, 160 by 2028, 180 by 2029, 198 by 2030, the building's 2013 state-approved rating. Miss them on a fair trial and the next facility plan revisits with evidence. Recovered students are priced at supplies-only absorption; each new section a lumpy grade forces costs about $60,000 to $85,000 against this line. Every line is from district documents: basis in report Section 10, live formulas in the model's Alternatives tab.

A suggestion: three committees to run the growth plan

A plan without owners is a wish. We ask for three standing committees, one per lever, each with a public charge and a progress report at every board meeting:

  • An enrollment growth committee to win families back: reach the 236 homeschool households in the district's own files, market the county's top-scoring elementary to the 450 to 550 Bourbon County Schools kids now outside its classrooms, and own the public targets of 145, 160, 180, and 198.
  • A fixed-cost committee to drive the $760,000 to $1.3 million package: commission the routing study the $2.9 million bus line has never had, review every non-teaching vacancy before it is refilled, and put the energy contracts out to bid.
  • A revenue committee to lay the rate choices in front of the public: what each step on the menu funds, what it costs the median homeowner per month, and a path back to the board's own 2018 rate.

Committees commit no new money. They turn a website plan into work with names on it. Seat parents, teachers, and business owners next to board members; publish what each group finds. Volunteers from the NMES community stand at the ready to serve on all three.

The Decision

Two roads.

SHRINK TO FIT GROW AND THRIVE
Shrink to Fit: close NMES
-$427,087
a year: the weighted median of all 972 closure scenarios
Grow and Thrive: grow NMES
+$141,780
a year: the default growth scenario, the median of 19,683 weighted scenarios
Grow the district
+$3.4M
a year of gross new revenue and savings at the three levers' defaults: the priced plan above

One road closes the county's best school. Every priced outcome loses money, because the families it counts on staying signed their names saying they will not. The other fills seats, cuts real costs, fixes the rate, and competes for families this county never lost. Closure now prices as a six-figure annual loss in the middle case. Growth pays in every priced scenario. That comparison is not close.

Five elected board members own this choice. This page puts the whole record in their hands: the facts, the priced plan, committees ready to work, and a community ready to stand behind a board that chooses growth.

On North Middletown, Specifically

Four asks that commit no new money.

One, keep the school listed as Permanent in the facility plan. Two, give it the four years to the next plan, with public targets and the tools to hit them. Three, let the community fund the building with grants, private money, and donated labor. Four, say publicly that the district will grow this school.

More detail: the four asks

1. Keep NMES Permanent in the facility plan

A facility plan commits no money; Priority 2 exists for needs not yet funded. "Transitional" saves nothing this year either, but blocks state facility funding and declares a phase-out. Same cost, zero; only one keeps every door open.

2. Give the school four years, with public targets, and the tools to hit them

Set public targets and let the school and community run a real push, judged on results. Two tools to weigh: a themed academy in arts, technology, or agriculture and outdoor sciences, or a promise scholarship, donor- and grant-funded, paying every NMES graduate toward college, trade school, or any certification. A lasting reason to enroll, at no district cost. Hit the targets and everything recovers. Miss them fairly and the next plan decides with evidence.

3. Let the community fund the building

Grants, private money, and donated labor and materials can carry the building's real needs at no district cost. The district's role is one board-motion sentence: accept the help.

4. Say publicly that the district will grow this school

A closure cloud drives families out before any vote. A public growth commitment commits no new money and is the cheapest enrollment lever the board owns. There is no pot of money growth would squander: with staff reassigned, closure frees only the $79,211 of building costs in Part One. Every attrition dollar closure could harvest, Lever two harvests without closing anything.

Act Now

What you can do this week.

Join every public forum

Local Planning Committee • Board of Education

The committee that voted "transitional" and the deciding board both meet in public. Hearings are still ahead. The district will announce the next public forums; watch the district site. The committee's vote is advisory; the audience is not.

Sign and share

Two minutes

Sign the petition asking the board to pause any vote until a written closure analysis with both sides of the ledger exists. The district's records response says none does.

Sign the petition

Write the board

Five minutes

Superintendent Larry Begley and board members Bradley Purcell (chairman), Jonathan Ott (vice chairman), Mandy Thornberry, Miranda Wyles, and Shane Buckler. Ask for one thing: answers in writing before any vote.

Start an email  Call the central office: 859-987-2180

Share your NMES story

Alumni, parents, teachers

If you are a King, your story belongs in this record. Include your name, connection, and a phone number so we can verify. Nothing runs without your permission.

Share your story
The Families Answered

School choice survey: the results

In August 2026 we asked NMES families the one question the district's plan never prices: if the school closes, what would your family actually do? Forty-two responses came in. Minus duplicates, plus one late family with one child, 38 households answered for 85 children:

The responses:

Where the leaving children would go:

Shares are of the 85 surveyed children, who include current students, younger siblings, and children not yet in school. The leaving children come from 31 households; the staying children from 6; the already-left from 1.

The other-or-undecided row includes seven children marked with an in-district school; because their families say they would leave Bourbon County Schools, they count here. The data, names and dates removed, is published as survey_school_choice_2026_08_anonymized.csv. Personal information is never published. The form is closed; results went to the board.

Follow the numbers. Of the 75 surveyed children enrolled now or entering by fall 2028, 62 would leave: 83 percent. We discount that hard, assuming the families who did not respond lean the other way and a gap between stated and revealed preference (method in the report; every number reproduces from the open repository). The corrected result: 43 to 57 percent of the school leaves, median 50 percent, or 49 to 65 of the 115 children in the building today. The same community feeds every future class, about 22 kindergartners a year, so at steady state that is 117 to 154 students missing from the district's rolls every year, $599,742 to $789,404 a year. The closure model prices exactly that band. Their named destinations, tabled above, are open today.

More ways to help: Frankfort contacts and the QR code

Take it to Frankfort

Closure is not final until the Kentucky Board of Education approves the facility plan. Ask each office for one thing: a fair, documented process, questions answered in writing, before any vote.

Rep. Matthew Koch, Kentucky House District 72 (Bourbon, Fleming, and Nicholas counties).

Start an email to Rep. Koch  Message line: 1-800-372-7181

Sen. Steve West, Kentucky Senate District 27, which includes Bourbon County.

Start an email to Sen. West  Message line: 1-800-372-7181

Kentucky Board of Education, the state board that must approve the district's facility plan (chaired by Sharon Porter Robinson).

Start an email to the state board  Call the board: (502) 564-3141

Gov. Andy Beshear, who appoints the Board of Education.

Open the Governor's contact form  Call the Governor: (502) 564-2611

Contact channels checked against each office's website, July 2026. Be brief and respectful.

Spread the word

QR code that opens SaveNMES.org, with SaveNMES.org printed beneath it

This QR code opens SaveNMES.org. Put it on flyers, yard signs, church bulletins, and handouts. It prints cleanly down to one inch square.

Download the QR code (PNG)
In Their Own Words

Voices of North Middletown.

The record is not all numbers. This impacts real families: about one hundred supporters filled the July 15 forum. Hear from them, past and present, below.

There is always a solution to a problem if you persist through it. The lesson Mrs. Mitchell's classroom taught me, 24 years ago, in this building.
Read the stories

Your story could be the first one here.

If NMES taught you, taught your children, or employed you, that is evidence too. Send your story. It runs only after we talk and you approve the exact words.

Share your story

Every story is submitted by its author or reposted with explicit permission. Identity and connection are verified first. Phone numbers are never published. Any author can have their story removed by asking.

Check Everything

The full report, the model, and every source.

The three-page summary, the full report, and the model. Behind them, the open repository: every dataset, script, and archived district document. Every version ever published stays public, corrections included.

Executive summary (3 pages, PDF)   Download the full report (PDF)   Download the financial model (Excel)   Browse the repository

Version history: every version stays public

Every version stays public

The 55-page report and the complete financial model behind every number on this page. The open GitHub repository holds the source for all of it, including every archived district document.

Version history (each report's corrections section lists what changed and why): v5.0, August 17 (the school-choice survey results published anonymized and the closure grid rebuilt on them: survey-anchored leavers at steady state priced at the statistical band's middle half (the signed floor of 74 kept as evidence below every priced leg), the busing high leg capped at $95,000 and the speculative property lever dropped while the PVA records request is pending, 972 scenarios, median loses $427,087, every priced scenario loses money; the evidence window spans current enrollment plus the next three entering classes; the exodus estimate restated as a share of the current student population extended to the whole feeder stream, with the response-bias factor centered at 3.5x and floored at 3.3x, Pew's lower high-salience benchmark, chosen for a small, emotionally charged respondent pool; survey results expressed as shares of current enrollment with a destination breakdown, leaving families who marked an in-district school folded into the other-or-undecided row; open-enrollment case studies added with sources; the SEEK base is the enacted FY2027 figure of $4,626 (2026 Ky. Acts ch. 168, HB 500, p. 20, archived in build/; an interim draft of this release wrongly moved it to $4,636 and that error is corrected here); the supplies credit now scales with each missing student and staffing savings are priced only on the teachers lever, so nothing is counted twice; multi-year totals retired in favor of per-year figures; the facility plan's "128" traced to the 2024-25 SAAR end-of-year file and the label corrected from 2023-24; the current-enrollment baseline restated on the 2025-26 end-of-year count of 115, with capacity and cost comparisons kept on the official 2024-25 filings at 128; the score-suppression label corrected to KDE's written fewer-than-three rule; the research base added to Sources, including the published measurements that anchor the survey's response-bias correction) · v4.6, August 3 (the per-cent-of-rate tax yield corrected to the audit's own real estate roll, $166,189, and every dependent figure re-based; the Fayette same-year comparison added) · v4.5, August 2 (explicit lever weights on both grids, triangular where the record pins a center, uniform where it does not; middle halves published; KY average back to 2012 on the cost chart) · v4.4, August 1 (growth model on the district's own class caps, all 19,683 scenarios pay; the transformative check; five asks; Blue Ribbon added; version history replaces correction notes) · v4.2, August 1 (rebuilt on the district's 48-page response: its own staffing prices, 0-3 teachers, leakage to 50 percent; median flips negative) · v4.1, July 31 (Millersburg case study kept; the cohort-leakage claim withdrawn; the four asks revised) · v4.0, July 31 (restructured around the two cases and the choice; executive summary added) · v3.9, July 29 (the district's ledger published; the closure grid rebuilt on measured fixed lines) · v3.8, July 26 (the fill planner charges for new sections; the 25-year cost record) · v3.7, July 26 (the recallable levy options priced) · v3.6, July 26 (fourteen years of levies, nine districts) · v3.5, July 26 (correction release from our own adversarial audit) · v3.4, July 26 (the full 163-event closure distribution) · v3.3, July 26 (thirty years of Kentucky rural closures tested) · v3.2, July 26 (the recruitment pool measured) · v3.1, July 26 (building condition from every KFICS report) · v3.0, July 26 (two-tailed closure economics) · v2.7, July 25 (the June 2026 capital transfer decomposed) · v2.6, July 20 (the bonding story and transport geography).

Check My Work

Sources

Every figure on this page traces to a public record: the key documents are listed here, and every archived file lives in the open repository. Find an error and I will correct it publicly.

See every source (52)